Introduction
In South Korea, it has been shown that the number of bovine slaughter heads exceeded 1.0 million in 2023, and 1.1 million in 2024 (KAPE, 2025; KMTA, 2025). Among Hanwoo heads, 451,000 were steers and 411,000 were cows in 2023, 455,000 were steers, and 469,000 were cows in 2023. This is a well-established feeding standard for maximizing Hanwoo steer productivity. However, in the case of cows, this is not applicable because most are culled cows due to the loss of productivity, as their quality grades were poor due to excessive subcutaneous fat and lack of marbling resulting from oversupplementation of concentrate and a short finishing period (NIAS, 2022). In addition, there are several limitations to establishing a feeding standard, such as an unspecific slaughter age. Thus, the cow feeding regime is extremely dependent on the farmer. Considering that the quality grade of cows is poorer than that of steers, and the number of heads is similar, it is necessary to conduct additional research on cow feeding to increase farm productivity and consumer satisfaction.
Due to the rise in international grain prices, the economic burden on concentrated feed has increased, leading some farms to reduce beef production costs by using feed they produce themselves, such as various agricultural by-products and forage (Choi et al., 2024). In terms of reducing production cost, ‘boiled feed’ is a feeding regime that involves boiling agricultural by-products in a large cauldron, and it originated from traditional agrarian society (Kim et al., 2021). Generally, boiled feeding has an economic advantage because it utilizes by-products such as rice straw and rice bran (Choi et al., 2017). In addition, a previous study reported that boiling is beneficial to rumen digestibility, since the silica-lignin-cellulose binding of forage, which is difficult to digest, is weakened by the boiling procedure (Zhang et al., 2017). Choi et al. (2017) reported a better yield grade of boil-fed steers by decreasing carcass weight and back fat thickness and increasing loin-eye area, whereas there were no significant differences in quality grade. For this reason, some farms adopt underburden cost boiled feeding to overcome low profitability owing to the comparatively lower quality grade compared to steers.
Thus, the aim of this study was to investigate the quality grade and meat quality of beef fed with common/boiled feed as a fundamental study in order to establish a standardized feeding regime or cow feeding standard, including technology for improving cow beef quality.
Materials & methods
Beef cows which were finished with Korean Feeding Standard for Hanwoo (NIAS, 2022) (finishing with normal feed based on Korean feeding standard for Hanwoo, CON; n=10) or boiled feed (finishing with boiled feed, TR; n=10) were selected from a commercial slaughterhouse. The details of the feed and feed nutrients for the CON and TR groups are shown in Table 1. Age and carcass weight of beef cow selected were 42.7±2.7 months and 416.3±10.2 kg for CON and 42.0±2.8 months and 400.4±9.1 kg for TR, respectively. The entire loin (from 1st thoracic vertebra to the 6th lumber vertebra) was removed from the left side of the carcasses 24h postmortem. The cut surface images of loin obtained between 7th and 8th thoracic vertebra were used to analyze loin-eye (M. longissimus thoracis) area (cm2), M. spnialis thoracis area (cm2), and intermuscular fat area (cm2) between M. longissimus thoracis and M. spnialis thoracis. Strip loin (M. longissimus lumborum) was cut into two pieces (10 cm thickness), vacuum packed, and stored in a cold room at 4?. Strip loins were removed from the packages at 48 h postmortem (day 2) and 15 days after storage (day 16) and used to evaluate meat quality, muscle fiber characteristics, and fatty acid and amino acid compositions.
Based on the data from NIAS (2022).
CON, finishing with normal feed based on Korean feeding standard for Hanwoo; TR, finishing with boiled feed; NA, not applicable; DM, dry matter; CP, crude protein, Sol-CP, soluble CP; ADICP, acid detergent insoluble CP; NDICP, neutral detergent insoluble CP; ADF, acid detergent fiber; NDF, neutral detergent fiber; NFC, non-fiber carbohydrate; TDN, total digestible nutrient.
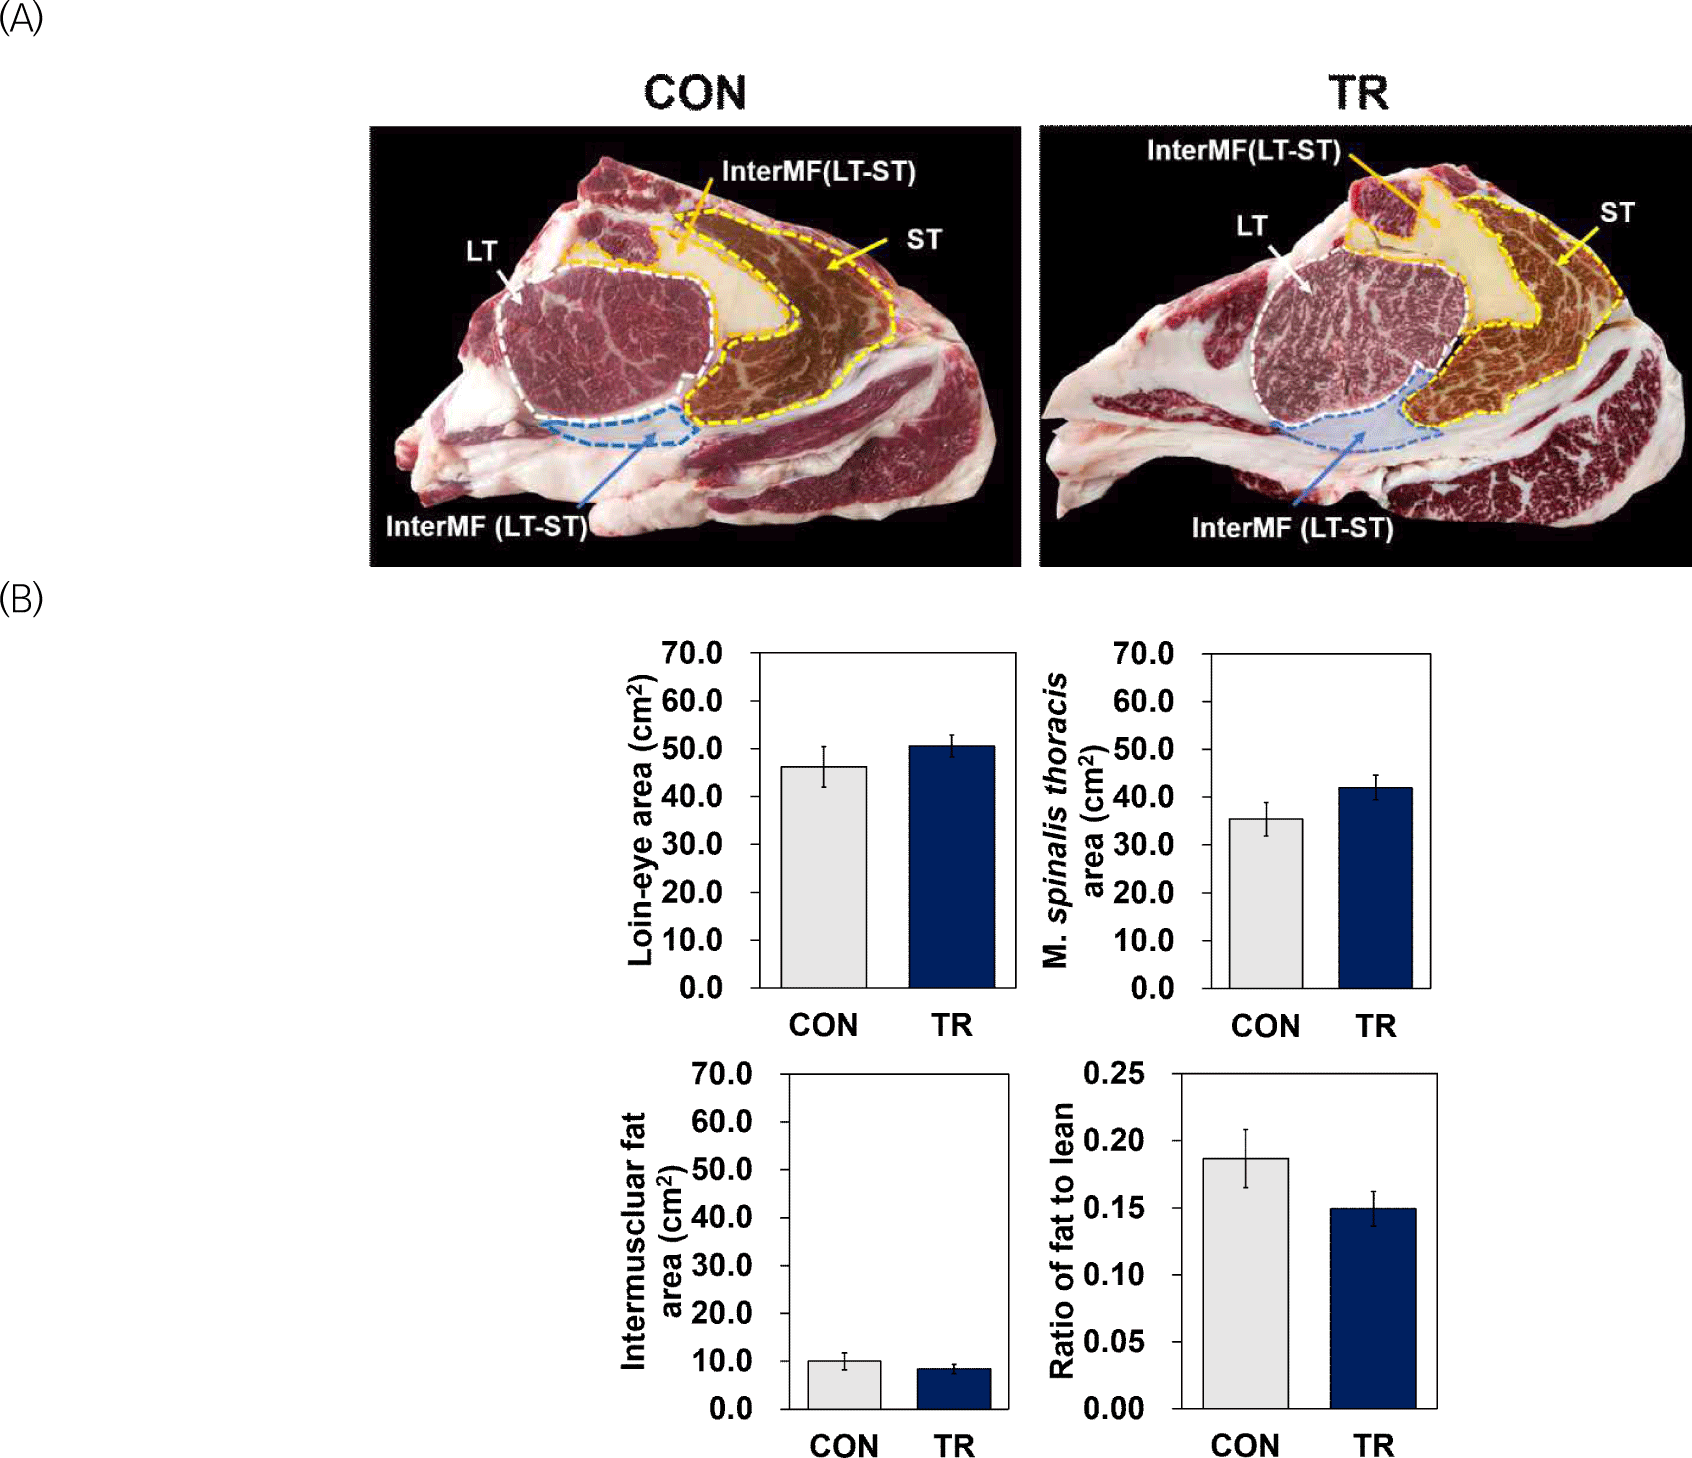
The intermuscular fat area between the M. longissimus thoracis and M. spinalis thoracis, the areas of the loin eye (M.longissimus thoracis) and M. spinalis thoracis, and the ratio of fat to lean were analyzed using Image Pro Plus (Media Cybernetics, Rockville, MD, USA) according to the method described by Im et al. (2024) with some modifications.
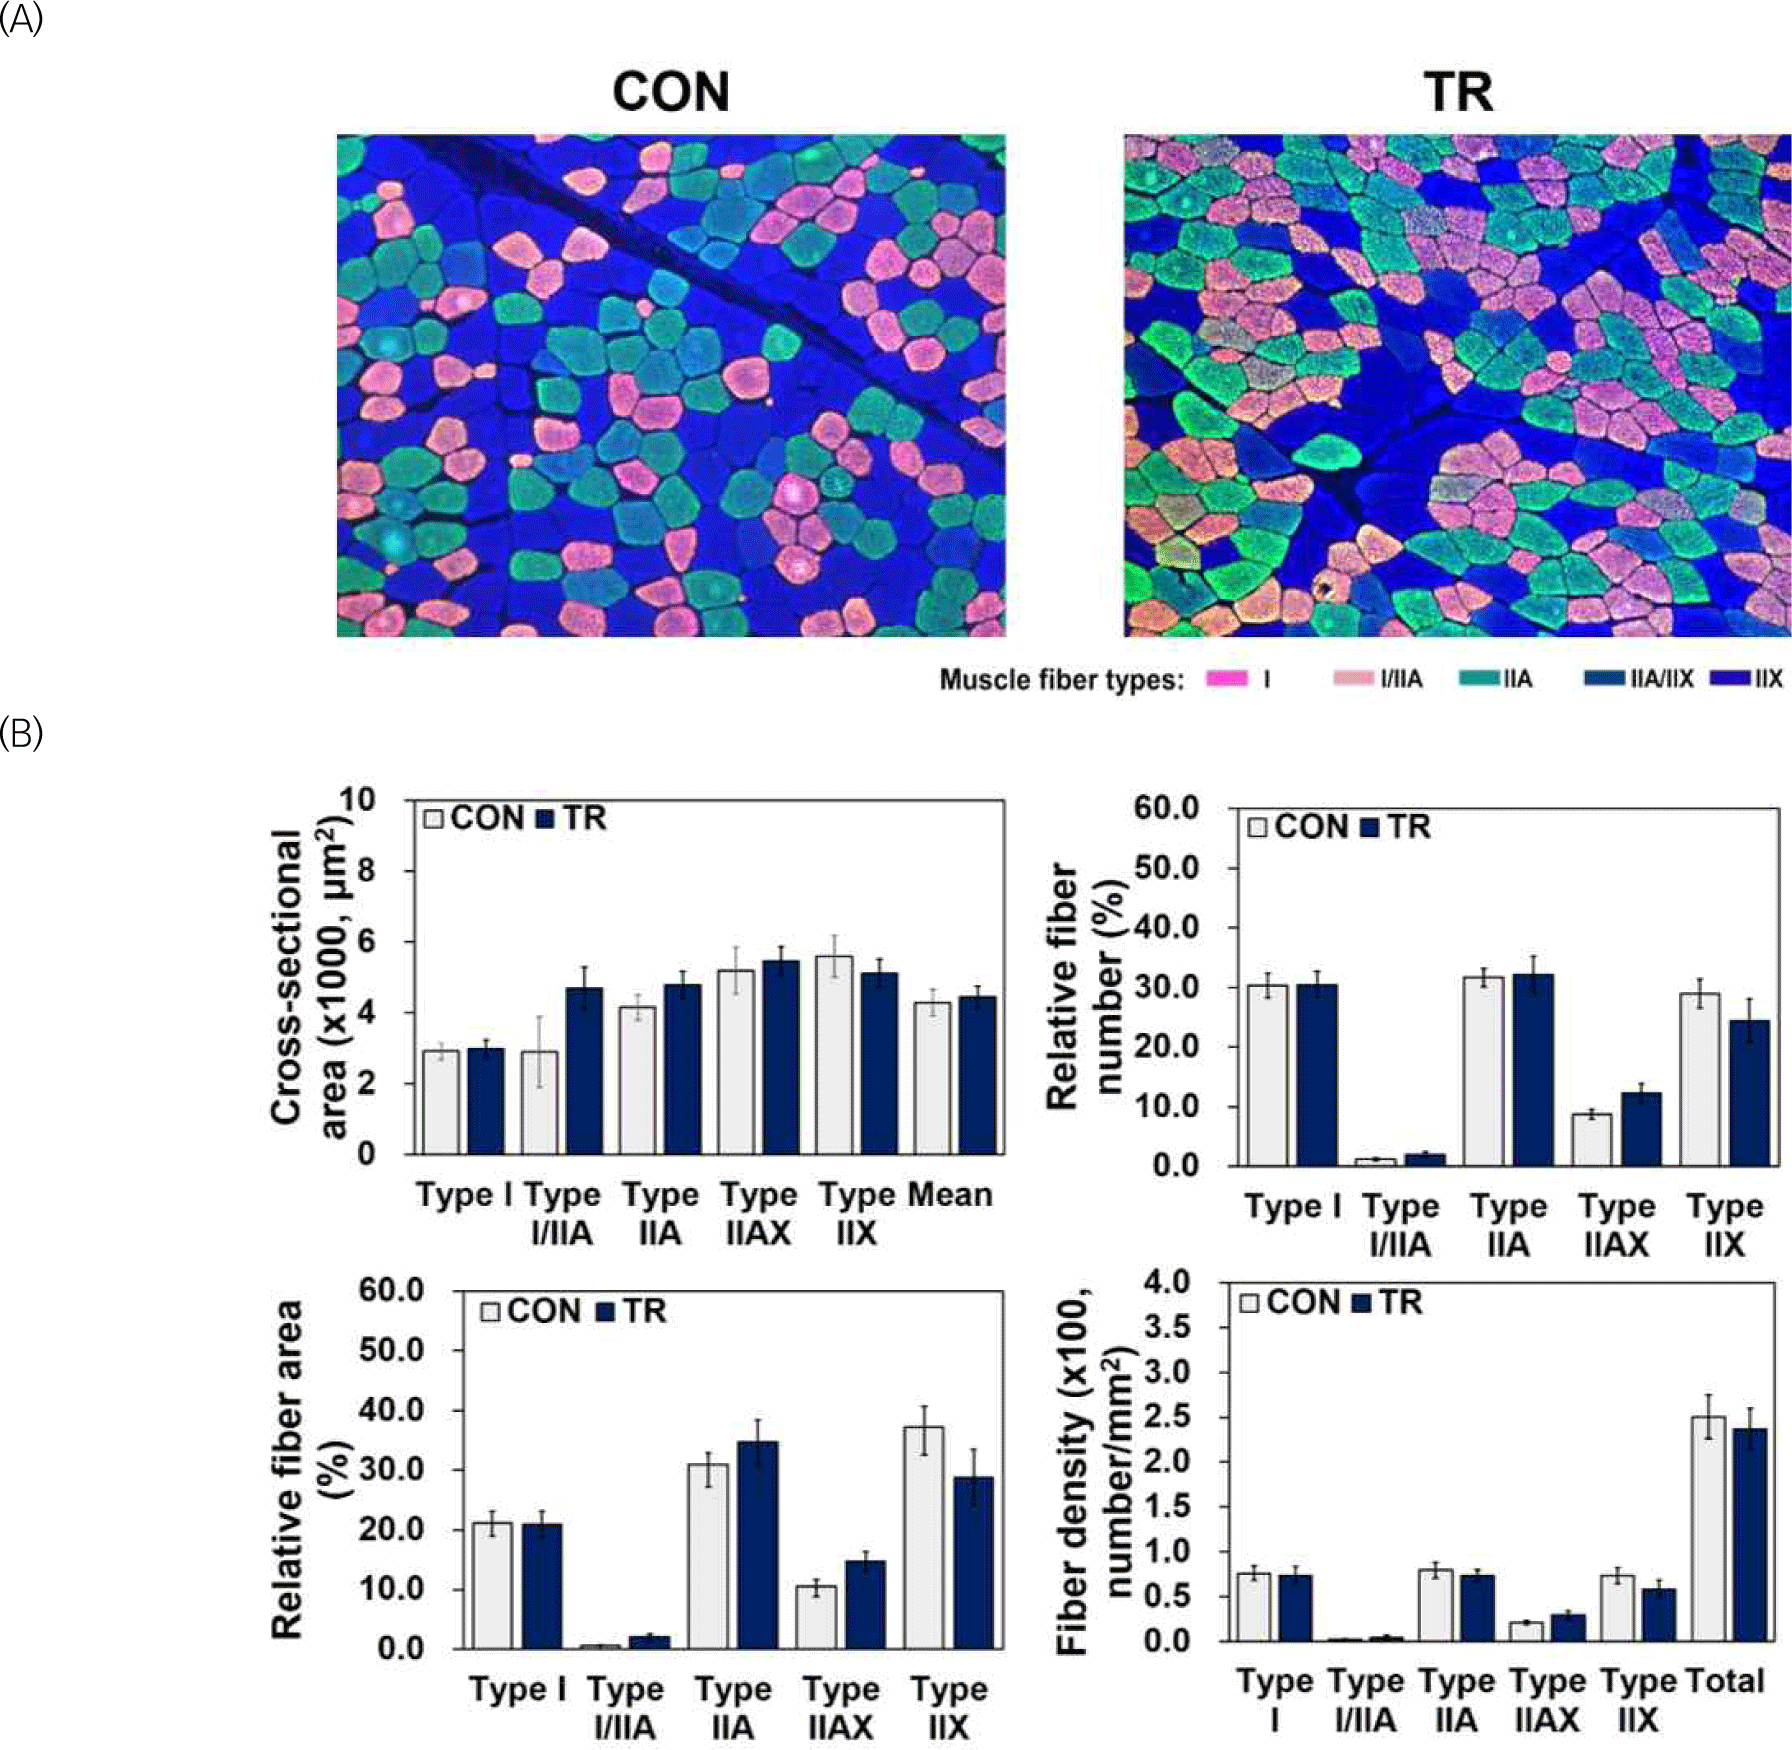
The muscle fiber characteristics of bovine striploins were evaluated using an immunohistochemical staining method described by Song et al. (2020). Briefly, frozen samples in methyl butane were sliced into 10 μm transversal section using a cryostat microtome (CM1520; Leica Biosystems, Wetzlar, Germany) at –20?. Samples were blocked immediately in 10% normal goat serum (Cell Signaling Technology, Danvers, MA, USA), then, stained with primary antibodies specific to myosin heavy chain isoforms (BA-F8, SC-71, BF-35, and 6H1, Developmental Studies Hybridoma Bank, Iowa City, IA, USA). Fluorescent dye-conjugated secondary anti-IgG and anti-IgM antibodies (Alexa Fluor 405, 488, and 594; Thermo Fisher Scientific, Waltham, MA, USA) were used for incubation. Stained muscle fibers were visualized under a fluorescence microscope (EVOS M5000; Thermo Fisher Scientific). Three fields of each sections were used to analyze with Image Pro Plus Program (Media Cybernetics), and cross-sectional area (CSA; μm2), relative fiber area/number (%), and density (number/mm2) of each fiber type were analyzed.
The proximate composition of strip loin from cows was determined using the method of AOAC (2000) for moisture and crude ash, the method of Kjeldahl (AOAC, 2000) for crude protein, and Folch et al. (1957) for crude fat with modifications. 10 g of samples were dried at 105? for 24 h using dry oven (DH.WOC00560, Daihan Scientific, Wonju, Korea). Crude ash was analyzed by drying at 200? then, burned at 400, 600, and 800? for 2 h. Both moisture and crude ash were expressed as percentage by calculate using before and after weight. Following the Kjeldahl method (AOAC, 2000), samples (0.5 g) were digested with sulfuric acid and ammonia and then distilled into boric acid. Crude protein content was obtained by multiplying the total nitrogen content by 6.25 using titrated borate anions with hydrochloric acid. For the crude fat contents, 5.0 g of each sample was homogenized in 35 mL of Folch solution (chloroform:methanol, 2:1, v:v) and 1 mL of internal fatty standard (C13:0, 0.5 mg/mL in methanol) for further fatty acid analysis. The homogenates were then filtered through Whatman No. 1 filter paper (Merck, Darmstadt, Germany). By adding 0.88% NaCl, filtrate was separated into two layers. After the upper layer was removed, 10 mL of the lower layer was collected and evaporated with nitrogen gas. Crude fat content was expressed as a percentage of the sample.
For the meat color, D65 light source, 8° illumination, and 8 mm measuring aperture equipped colorimeter (CR-400, Minolta, Tokyo, Japan) was utilized to instrumental color measurement after 20 min of blooming at 4?. The colorimeter was calibrated using a white plate (Y=93.5, x=0.3132, and y=0.3198). The Commission Internationale de l’ Eclairage system (Commission Internationale de I’Eclairage, 1978) was adopted in order to express the results in terms of lightness (CIE L*), redness (CIE a*), and yellowness (CIE b*). Three grams of samples were homogenized in 27 mL distilled water. The pH was determined immediately using a pH meter (S220, Mettler Toledo, Greifensee, Switzerland) equipped with a temperature-adaptation probe. Before the measurement, calibration was conducted using standard buffer solutions with pH 4.01, 7.00, and 9.21 at 20?. Drip and cooking losses were measured to evaluate water-holding capacity. Drip loss was measured by suspending 50 g of sample for 24 h at 1?, and calculated using before and after suspension weight as described by Honikel (1987). Cooking loss was measured as the change in weight before and after cooking in a water bath (WB-22, Daihan Scientific). Sixty samples were randomly assigned to six batches of ten samples each. Cooking was accomplished when the internal temperature reached to 70?, and cooled for 30 min at room temperature, then samples were weighted. The results were expressed as a percentage of the initial weight. From the cooked samples, three cores of 1 cm in diameter were obtained following muscle fiber orientation. A texture analyzer (TA1; Ametek, Berwyn, PA, USA) equipped with a Warner–Bratzler shear blade was used to determine the Warner-Bratzler shear force. The shear force values were recorded as N/cm2 and were obtained by vertical shearing at 3.00 mm/s speed with a 50 kgf of load cell capacity.
Fatty acids were analyzed as described by Kim et al. (2021). Briefly, 1 mL of dichloromethane was added to the evaporated sample to analyze the crude fat content, which was then transferred to a glass tube and reacted with 1 mL of 1 N methanolic NaOH for saponification. After heating in the heating block at 90? for 10 min and cooling at room temperature for 20 min, 1 mL of 14% boron trifluoride-methanol solution was added for subsequent methylation. After heating and cooling, 3 mL hexane and 8 mL distilled water were added, and the mixture was allowed to stand overnight for layer separation. One milliliter of upper layer was moved to vial and used for fatty acid analysis using a GC machine (8890, Agilent Technologies, Santa Clara, CA, USA) equipping Supleco SP-2560 capillary column (100m × 0.25 mm i.d., 0–20 μm film thickness, Sigma-Aldrich, St. Louis, MO, USA). Detail conditions of the GC are as follows; inlet temperature, 220?; split mode with 10:1 split ratio; oven temperature, 100? (4 min) at 25?/min to 200? (8 min), and at 5?/min to 250? (6 min); injection volume, 1 μL; column flow, 2.4 mL/min of nitrogen as carrier gas; detector temperature, 250?. A fatty acid methyl ester (FAME) standard (FAME Mix CRM-47885, Sigma-Aldrich) was used to identify the samples and compare their retention times. The total fatty acid content was expressed in milligrams per gram of sample. The fatty acid composition was expressed as a percentage of total fatty acids after quantification using the peak area of an internal standard.
For the amino acids analysis, 0.2 g of dried samples were hydrolyzed in 5 mL of 6 N HCl at 110? for 24 h. Hydrolysate were filtered through Whatman No. 1 filter paper, and adjust to 10 g filtrate with distilled water. After voltex, 1 mL of mixture fultered through a 0.2-μm membrane filter (Phenomenex, Torrance, CA, USA). The analyses were performed using a Dionex Ultimate 3000 HPLC system (Thermo Fisher Scientific). Chromatographic separation was achieved with a Inno C18 Column (150 × 4.6 mm, 5.0 μm; Youngjinbiochrom, Sungnam, Korea). Gradient elution was performed using a 40 mM sodium phosphate buffer (solvent A; pH 7) and water/acetonitrile/methanol (solvent B; 10:45:45, v/v/v). The following binary mobile phase linear gradients were used: 95% A at 0 min, 45% A at 24 min, 20% A at 25 min, and 95% A at 34.5 min. The column temperature and flow rate were 40? and 1.5 mL/min, respectively. The detection was performed using a fluorescence detector. Two derivatizing agents, o-phthaldialdehyde (OPA; Agilent Technologies) and 9-fluorenylmethoxycarbonyl chloride (FMOC; Agilent Technologies), were used simultaneously according to the manufacturer’s instructions. The excitation/emission wavelengths were 340/450 nm for the OPA-derivatized amino acids and 266/305 nm for the FMOC-derivatized amino acids. The concentrations of individual amino acids were determined using five-point calibration curves of an Amino Acid Standard (WAT088122, Waters, Milford, MA, USA).
All experimental data obtained from two different treatments (CON and TR) and two storage times (Day 2 and Day 16) with technical triplicates were expressed as means and standard error (SE). Student’s t-test was performed to compare muscle fiber characteristics, meat quality traits, fatty acids, and amino acids between the two groups of beef cows and two storage days (SAS software, ver. 9.4, SAS Institute, Carry, NC, USA). Differences were considered statistically significant at p<0.05.
Results and discussion
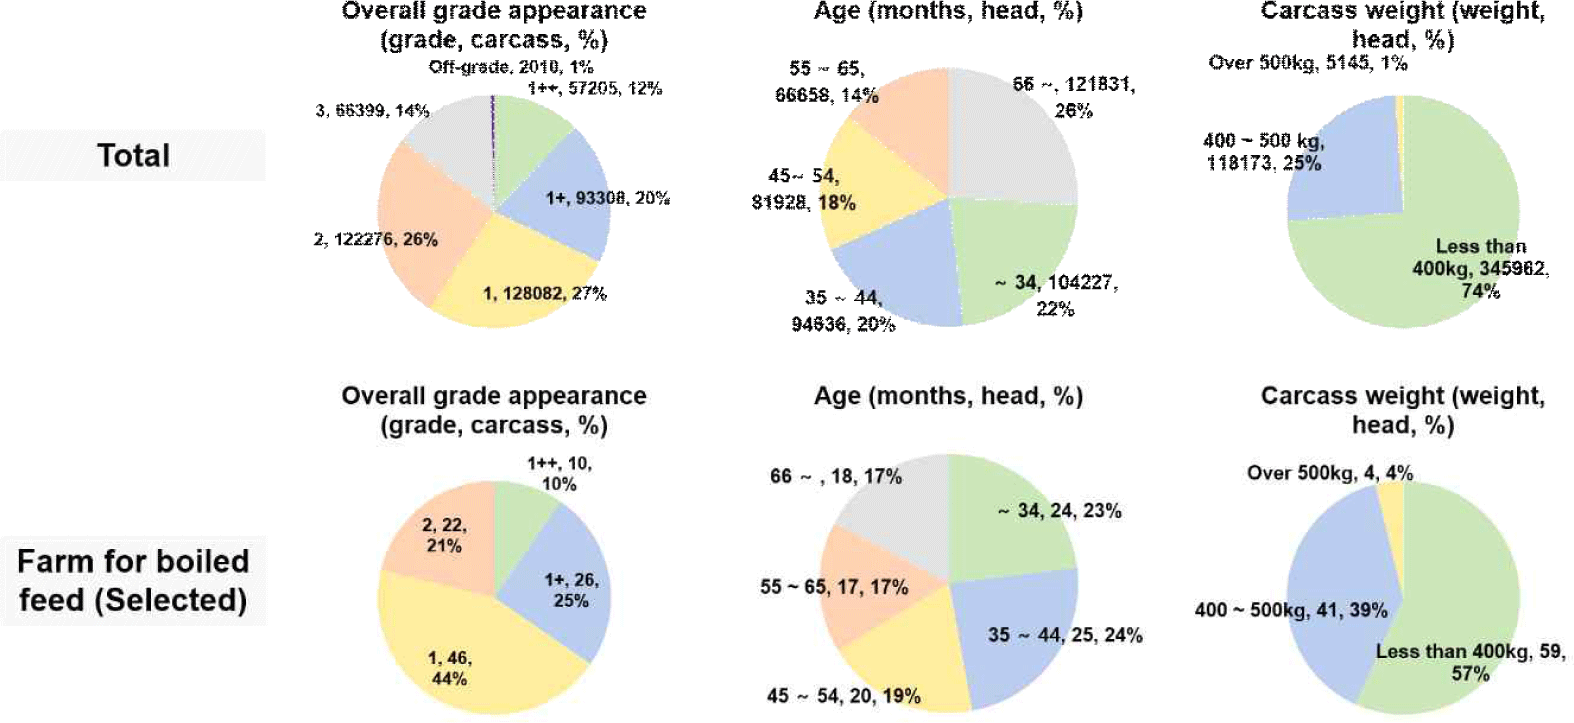
Fig. 1. shows the carcass grade, appearance rate, age, and carcass weight distribution of slaughtered cow carcasses in 2023. Among the total cow carcasses, grade 1 showed the highest appearance rate (27%), the same as a selected farm, while the ratio of grade 1 in the selected farm was 44%. The appearance rate of 1++ grade was 2% higher in total, that of 1+ grade was 5% higher in selected farms. And the ratio of grades lower than 1 (grades 2 and 3) was lower in selected farms (21%) than total (41%). Distribution of age of slaughtered cows older than 66 months showed highest ratio (26%) in total, whereas distribution of 35–44 months’ age was highest (24%) in selected farms. Except for those older than 66 months, the ratios of the other age ranges were higher on the selected farms. In the carcass weight distribution of the total slaughtered cows in 2023, the ‘less than 400 kg’ carcass was predominant, accounting for 74% of the carcass weight distribution. The ‘400–500 kg’ accounted for 25%, and only 1% was the ‘over 500 kg’. However, the carcass weight distribution of the slaughtered cows from selected farm showed 57, 39, and 4% of the ‘less than 400 kg, ‘400–500 kg’, and ‘over 500 kg,’ respectively. These results indicate that the slaughtered cows from the selected farms obtained higher quality grades and heavier carcass weights than the total number of slaughtered cows in Korea, although the cows were younger. A similar result, except for age, was found by Choi et al. (2017), who reported an increase in the quality grade of boiled feed without differences in meat quality.

Representative images of the cut surface, loin-eye area, spinalsis thoracis muscle area, intermuscular fat area, and fat-to-lean ratio of the loin between the 7th and 8ththoracic vertebrae are shown in Fig. 2. The fat-to-lean ratio tended to be lower in the TR group than in the CON group because of the larger spinalis thoracis muscle and smaller intermuscular fat area; however, the difference was not significant (p>0.05). Muscle size, especially the loin-eye area, has been shown to be related to carcass characteristics such as length or circumference in previous studies; however, it seems that similar grades led to no significant differences in the present study (Cole et al., 1960).

Representative stained images obtained using immunohistochemistry and muscle fiber characteristics are shown in Fig. 3. The CSA, relative fiber number and area, and density of each fiber were not significantly different (p>0.05). Considering that a previous study reported changes in muscle fiber characteristics by feeding regime in young bulls with a live weight under 460 kg, these results indicate that different feeding regimes do not lead to changes in the muscle fiber characteristics of cows whose growth is finished (Vestergaard et al., 2000).

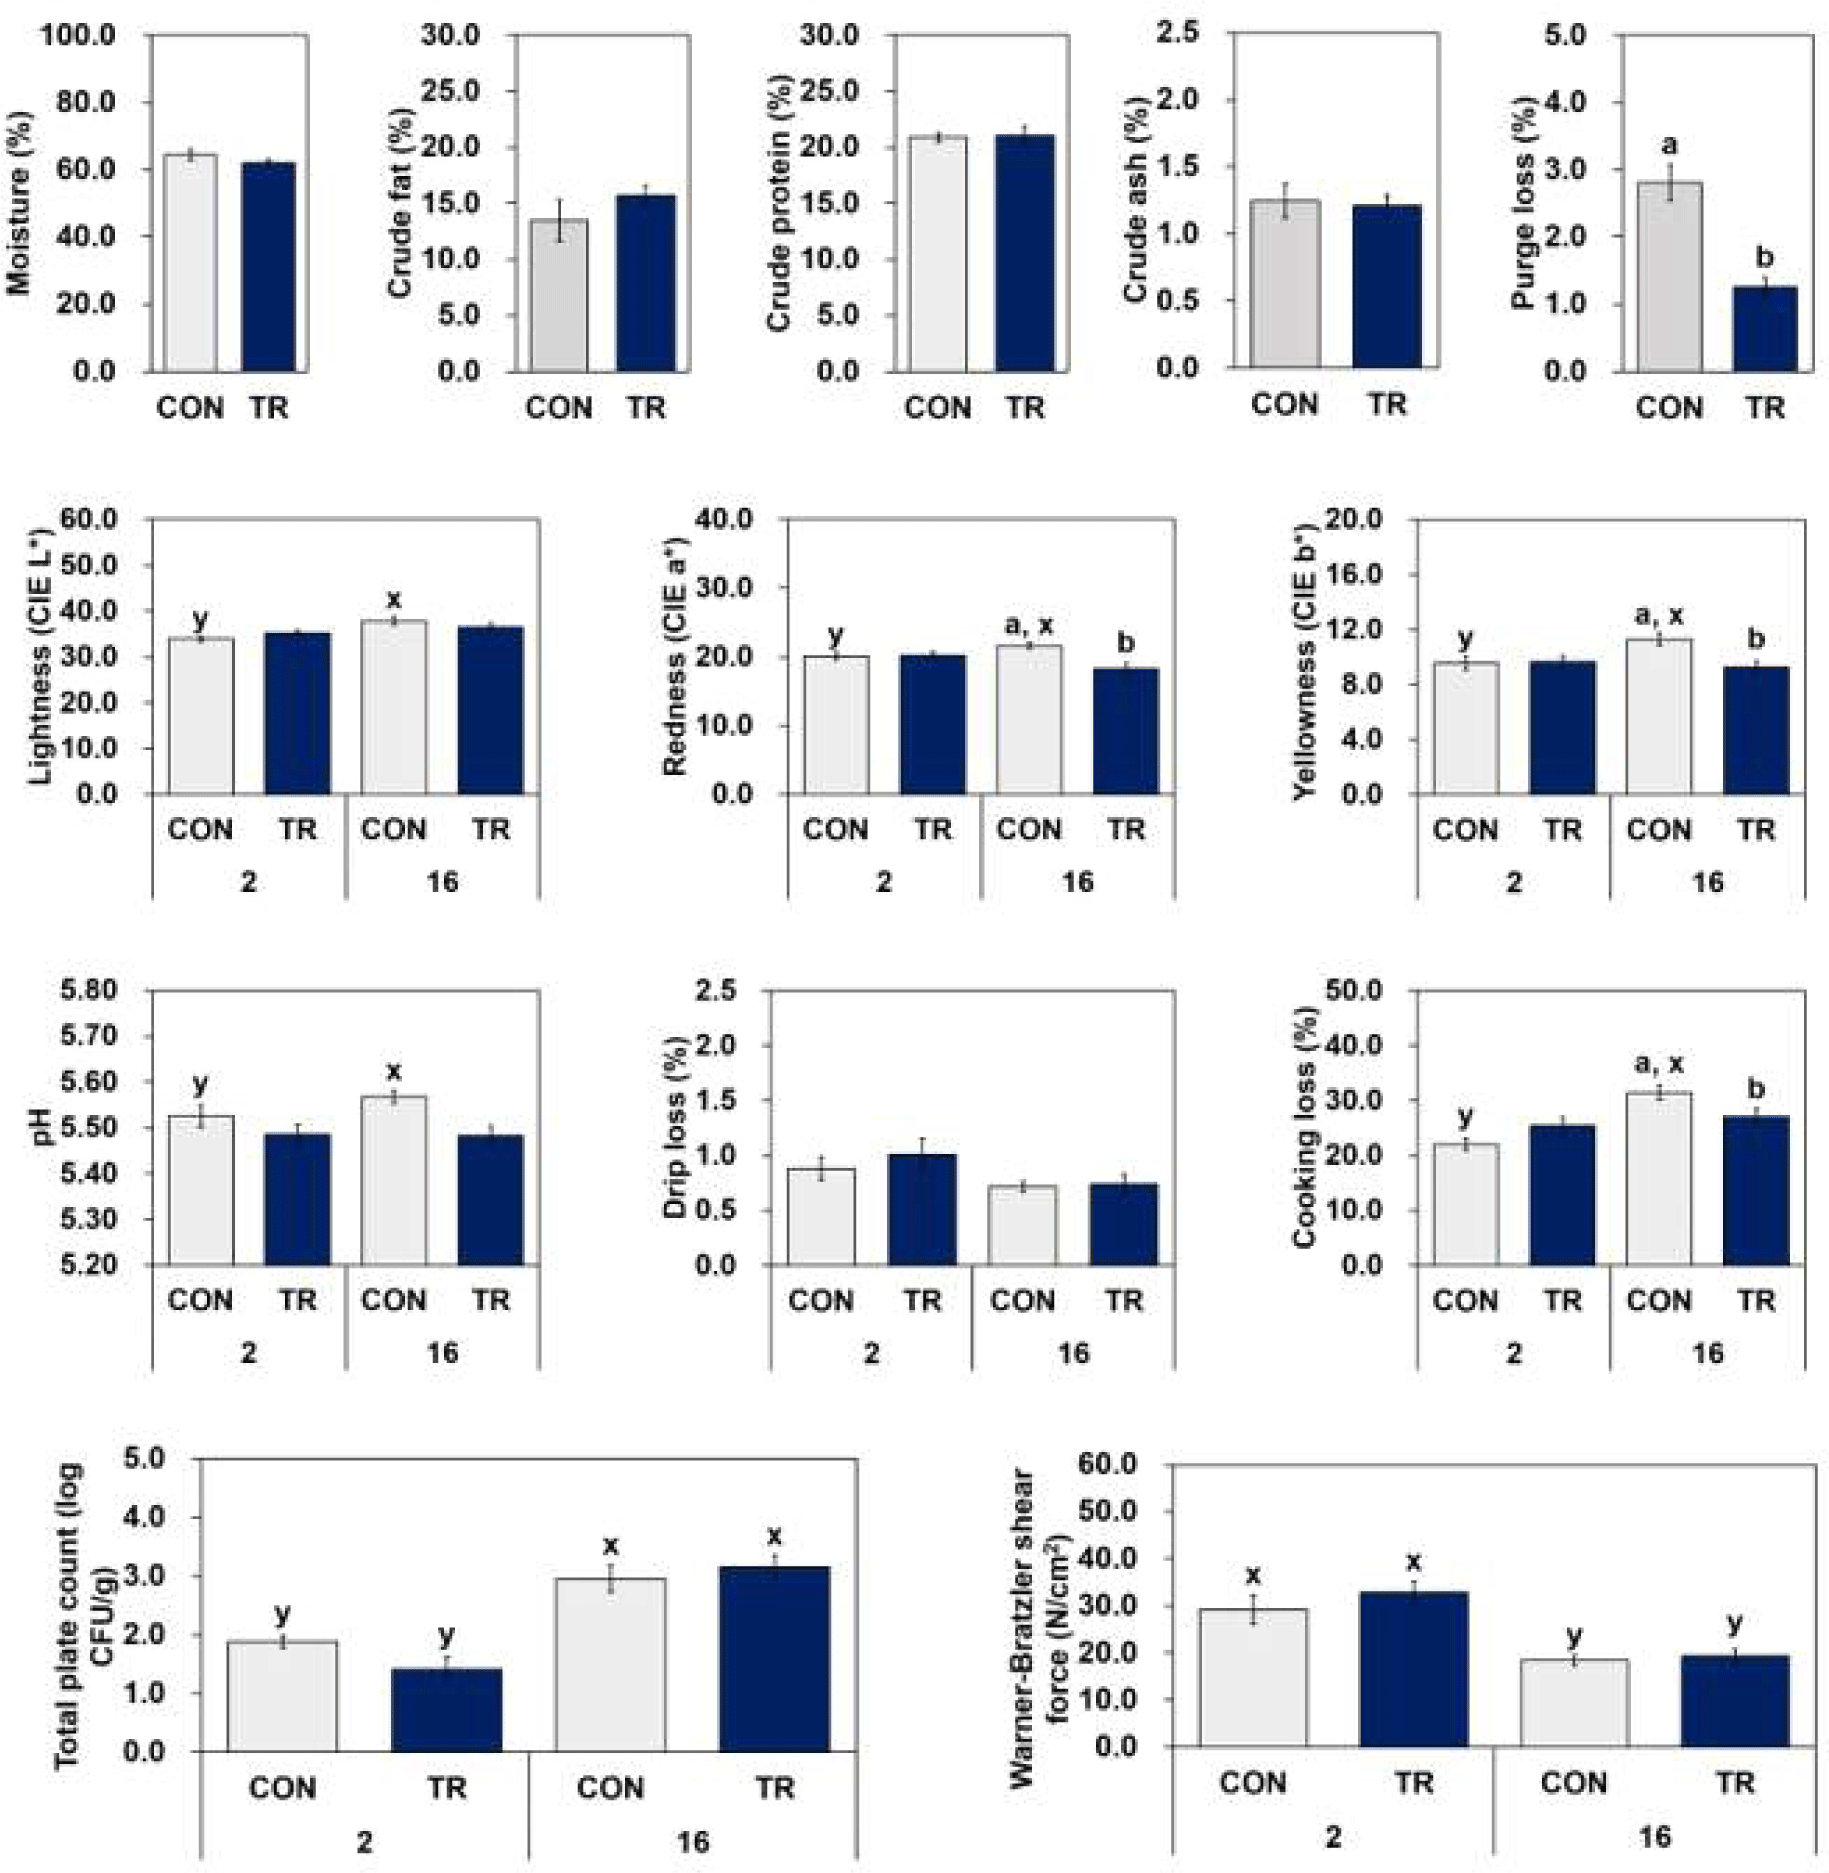
A Comparison of beef strip loin meat quality traits obtained from cows fed the Korean Feeding Standard for Hanwoo cattle and boiled feed is shown in Fig. 4. Proximate composition, lightness, pH, drip loss, aerobic microbial counts, and shear force did not show significant differences between the two group of beef strip loin from cow (p>0.05). Purge loss was higher in the CON group than in the TR group during aging, and redness and yellowness after aging were lower in the TR group than in the CON group (p<0.05). Similarly, cooking loss was lower in the TR group after aging (p<0.05). The effect of aging was greater in the CON group, as lightness, redness, yellowness, pH, cooking loss, and aerobic microbial count increased after aging (p<0.05). Beef strip loins from different feeding regime groups showed decreased shear force after aging (p<0.05). It seems that the color changes during aging are caused by the effect of mineral content in the boiled feed, such as iron and manganese, just as a previous study reported that beef strip loins fed with minerals such as copper, manganese, and zinc, showed significantly lower redness than a group where minerals were not added during storage (Harsh et al., 2018). In addition, Rossi et al. (2020) reported that a higher concentration of mineral content in supplements leads to lower redness and yellowness; therefore, feeding high concentrations of mineral content results in color stability differences during storage. Not only meat color, but water-holding capacity also seems to be affected by feed. As reported in previous study where the inclusion of conjugated linoleic acid in the feed affected the water-holding capacity of meat, it seems that the composition or type of feed changes the characteristics of skeletal muscle and intramuscular fat, thereby leading to changes in fatty acid composition, meat color, and water-holding capacity (Cheng and Sun. 2008).

The fatty acid compositions of beef strip loin obtained from the Korean feeding standard for Hanwoo (NIAS, 2022) and boiled feed-fed cows are shown in Table 2. The total fatty acid content showed no significant difference between the treatments (p>0.05). Many fatty acids, including octanoic acid (C8:0), decanoic acid (C10:0), and dodecanoic acid (C12:0), showed significant differences between the treatments and aging, and TR showed higher levels of unsaturated fatty acids and lower levels of saturated fatty acids (p<0.05). In addition, TR was higher in both mono- and polyunsaturated fatty acids, regardless of the storage day (p<0.05). Since a previous study discovered that saturated fatty acids are related to an increase in low-density lipoproteins, research interest has focused on fatty acids in food, and researchers have attempted to control the fatty acid composition of beef as well (Vahmani et al., 2015). For example, beef fatty acids are manipulated by breed, feeding regime, and feed. A previous study reported increased omega-3 fatty acids by feeding on forage during the finishing period (de Freitas et al., 2014). Ku et al. (2020) reported a decreased n-6/n-3 ratio in Hanwoo steers due to higher forage feed. Furthermore, Kim et al. (2021b) reported increased unsaturated fatty acid content in boiled steer beef. In the previous study, the overall expected degradability of neutral detergent fiber by rumen microbes was increased and tended to increase over 60 h of the in situ digestion model (Zhang et al., 2017). In other words, this suggests that the less digestible cellulose in forage is weakened by the boiling procedure, possibly resulting in beef with high unsaturated fatty acid content due to increased fiber digestion and absorption.
Based on the data from NIAS (2022).
CON, finishing with normal feed based on Korean Feeding Standard for Hanwoo; TR, finishing with boiled feed; IMF, intramuscular fat; SFA, saturated fatty acids; UFA, unsaturated fatty acids; MUFA, monounsaturated fatty acids; PUFA, polyunsaturated fatty acids; ∑n3, sum of n3 fatty acids; ∑n6, sum of n6 fatty acids; ∑n9, sum of n9 fatty acids.
The amino acid compositions of the two cow beef strip loins are shown in Table 3. No significant differences were found between the treatments (p>0.05). Amino acids are the basic units of proteins and are a major reason for meat consumption (Oh et al., 2016). Previous studies reported effect of gender on amino acids, but little effect of breed and carcass weight (Holló et al., 2001). Only a few studies have focused on the effect of feed on amino acids; Skelley et al. (1978) reported less change in amino acid composition than in fatty acid composition, supporting the present result that the effect of feed on beef amino acid composition is very little.
Based on the data from NIAS (2022).
Conclusion
Taken together, the characteristics of muscle and muscle fibers between common and boiled cow beef strip loin were not different, but some traits, including color, water-holding capacity, and fatty acid composition, were different. Considering that cows from the boiled feed group graded higher in the carcass quality grading (higher than 1 grade), these meat quality traits are advantageous in regard to the higher unsaturated and lower saturated fatty acid ratios of the cow beef fed with boiled feed, which can be accepted positively by consumers when compared to common cow beef. In addition, from the perspective of producers, it is thought that boiled feeding is a way to maximize productivity by not only lowering production costs using low-cost sources and agricultural by-products, but also raising profit by upgrading carcass grade.
