Introduction
Rising consumer demand for natural and sustainable products has driven the food industry to increasingly develop and incorporate plant-based ingredients as alternatives to animal-based ones. Current concerns regarding animal-based diets include human health risks (such as carcinogenicity, celiac disease, and obesity), environmental challenges (including carbon emissions and ecological footprints), and foodborne diseases (such as COVID-19). Therefore, an incremental transition from animal-based to plant-based protein foods may be beneficial for environmental sustainability, ethical considerations, food affordability, enhanced food safety, increased consumer demand, and addressing protein-energy malnutrition (Benković et al., 2023; Langyan et al., 2022).
Plant-based proteins are more environmentally sustainable than animal proteins, requiring less water, land, and energy for production. They provide essential amino acids and can offer complete protein nutrition (Li et al., 2024). In addition, incorporating plant-based proteins into the diet has been associated with reduced cholesterol levels and a lower risk of cardiovascular diseases, type 2 diabetes, as well as aiding in the management of menopausal symptoms (Sim et al., 2021; Xiao et al., 2023). Various sources of plant-based protein have been extensively studied, including cereals (Carvalho et al., 2019; Pereira et al., 2016), legumes (Argel et al., 2020; Serdaroğlu et al., 2005), pseudocereals (Tafadzwa et al., 2021; Öztürk-Kerimoğlu et al., 2020; Verma et al., 2019), as well as nuts, almonds, and seeds (Hautrive et al., 2019; Serdaroğlu et al., 2018; Yüncü et al., 2022) in different meat product formulations (Langyan et al., 2022, Lonnie et al., 2020). Although some plant-based proteins are insufficient in essential amino acids, pseudocereals such as quinoa and amaranth contain a good amount of lysine (Goldflus et al., 2006; Langyan et al., 2022).
Amaranth (Amaranthus spp.) is a highly nutritious pseudocereal cultivated for thousands of years across various regions of the world (Manyelo et al., 2020; Rahjerdi et al., 2015). Although variations in the nutritional composition of amaranth have been observed depending on soil conditions, fertilizers, and moisture availability, it generally contains 6.5%–11.1% moisture, 12.7%–19.8% protein, 1.7%–10.3% fat, 2.2%–3.5% ash, 40.5%–87.1% carbohydrate, 49.5%–73% starch, 2.4%–5.8% crude fiber, and 1.8%–37.6% dietary fiber on a dry basis (Malik et al., 2023, Manyelo et al., 2020). In literature data, amaranth has been used as an egg yolk replacer (Mohammadi et al., 2024), a potential binder (Longato et al., 2017; Tafadzwa et al., 2021; Sabzi Belekhkanlu et al., 2016; Verma et al., 2019), and a fat replacer (Farid et al., 2024; Rahman et al., 2023). However, only one study has investigated the utilization of amaranth flour as a beef replacer (Suychinov et al., 2023). Besides that, the effects of adding amaranth flour on rheological characteristics and oxidative stability have not been investigated in this study.
Red beetroot (Beta vulgaris L.) and its functional products have become increasingly popular for their potential health benefits in the food industry, often used as a natural colorant or additive. Red beetroots are rich in various phytochemicals, including betalains, phenolic acids, and flavonoids. Betalains, which give beetroots their distinctive red color, are the main pigments and have been studied for their antioxidant and anti-inflammatory properties (Babarykin et al., 2019; El-Mesallamy et al., 2020).
In light of these data, this study aimed to examine the nutritional, technological, instrumental, rheological, and oxidative quality changes in model system meat emulsions based on varying levels of beef replacement and amaranth gel inclusion.
Materials and Methods
Post-rigor beef (M. semitendinosus, 73.7% moisture, 19.6% protein, 4.8% fat, and 1.9% ash) and beef fat were purchased from a local butcher in Izmir. Yellow-gold amaranth flour (pH 5.59, CIE L*: 65.21, CIE a*: 2.50, CIE b*: 13.74) and red beetroot powder (pH 6.07, CIE L*: 44.65, CIE a*: 15.22, CIE b*: 6.77) were supplied gluten-free by Aktarloji (Antalya, Turkey) and Ferişte Food (Bursa, Turkey), respectively. Amaranth flour has 18.5% protein, 8.40% fat, 2.8% saturated fat, 6.9% fiber, 2.3% sugar, and 59% carbohydrate according to the specifications of the supplier. All the chemicals were of analytical grade (Sigma-Aldrich Laborchemikalien GmbH, Seelze, Germany) and utilized without purification.
Amaranth gel (AG) was produced using the method of Botella-Martínez et al. (2020) with some modifications. Briefly, AG was prepared by mixing amaranth flour and distilled water at a ratio of 1:7. Then, the prepared mixture was homogenized at 2,168×g for 5 min using a high shear homogenizer (IKA ULTRA-TURRAX® T25, IKA Works, Staufen, Germany) to form a gel complex. The gel was then covered with parafilm to prevent moisture loss and surface drying and kept at +4°C for 24 h to ensure complete gelation. The pH value of amaranth gel was measured at 5.49, with CIE L*, a*, and b* values of 54.66, 0.80, and 9.63, respectively.
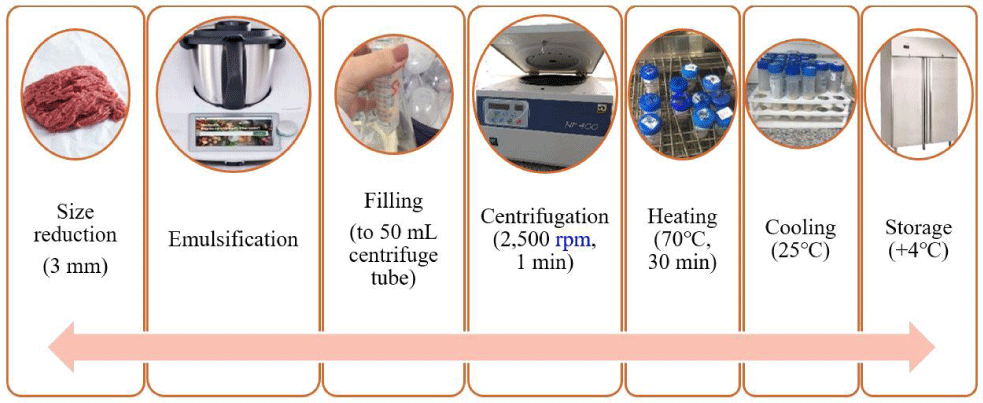
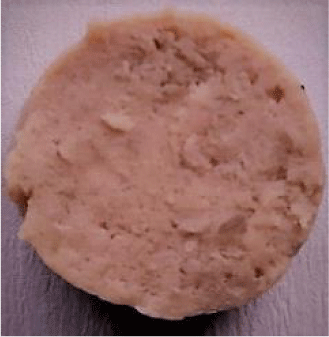
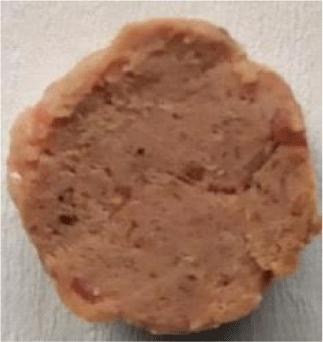
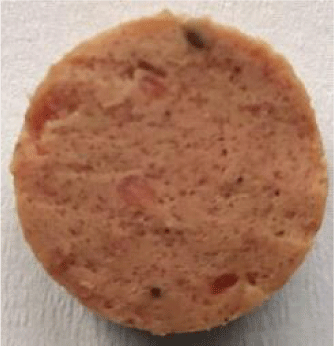
Meat emulsions (MEs) are produced using the method by Serdaroğlu et al. (2024) with some modifications and the production flow chart is presented in Fig. 1. Four batches (Table 1) were produced: in control samples (C) 100% beef meat was added in other formulations meat was substituted with amaranth gel at a level of 20% (A1), 30% (A2), and 40% (A3). In samples containing amaranth gel, red beetroot powder (2%) was utilized to achieve a similar color to that of the sample containing 100% beef. Lean beef and fat were minced separately using a meat grinder with a 3 mm plate (Arnica, Turkey). The minced meat was then homogenized for 1 min at 39×g in a Thermomix (Vorwerk, Wuppertal, Germany). Following this, Sodium tripolyphosphate (STPP), NaCl, ice, and red beetroot powder were added and emulsified at 39×g for 3 min. Subsequently, beef fat, half of the ice, and amaranth gel were incorporated, and the emulsification continued at 188×g for 3 min and 622×g for 2 min. During the process, the temperature was maintained below 12°C to prevent the emulsion from breaking. The prepared emulsions were then transferred in 50 mL centrifuge tubes, followed by centrifugation at 622×g for 1 min (Nüve, NF 400, Turkey) to eliminate air bubbles. The meat batters were cooked for 30 min at 70°C in a water bath (Nüve, Turkey). Following heat treatment, the MEs were quickly chilled in cold water at +1°C and subsequently stored at +4°C for 15 d (Fig. 1). Thiobarbituric acid reactive substances (TBARS) analysis was conducted in triplicate at 0, 7, and 15 d of storage to monitor lipid oxidation, while all other analyses were performed within 72 h of production. The entire meat emulsion production process was replicated twice, with two independent batches were produced on separate days, with related traits measured in triplicate for each batch.
| Treatments1) | Beef (%) | Beef fat (%) | Amaranth gel (%) | Ice (%) | Salt (%) | STPP (%) | Beetroot powder (%) |
|---|---|---|---|---|---|---|---|
| C | 70 | 18 | ND | 10 | 1.5 | 0.5 | - |
| A1 | 48 | 18 | 20 | 10 | 1.5 | 0.5 | 2 |
| A2 | 38 | 18 | 30 | 10 | 1.5 | 0.5 | 2 |
| A3 | 28 | 18 | 40 | 10 | 1.5 | 0.5 | 2 |
The moisture (Horwitz et al., 2000), fat (Flynn and Bramblett, 1975), protein (LECO dry combustion analyzer, FP528, LECO, St. Joseph, MI, USA), and ash (AOAC, 2012) contents were determined. The results were calculated as a percentage (%) of water per sample weight (g/100g). To determine the total energy value in kilocalories (kcal), Atwater values were applied, aligning with fat (9 kcal/g), protein (4.02 kcal/g), and carbohydrates (3.87 kcal/g), as specified by Mansour and Khalil in 2000.
To measure the pH of the amaranth and red beet powders, a 10 g sample of each was thoroughly mixed with 100 mL of distilled water. The mixture was homogenized using a high-speed blender (11,200×g for 2 min) to ensure complete uniformity. After homogenization, the mixture was allowed to sit at 25°C for approximately 5 min. During that time, the pH was allowed to equilibrate, and air bubbles were eliminated for more accurate measurement. The pH value of the MEs was measured by immersing the pH meter at 4 different points with the immersion tip electrode (Sentix, WTW electronic, Weilheim, Germany). pH measurements were performed in triplicate for each sample. The pH value was determined using a pH meter (WTW pH 3110 SET 2, WTW electronic) equipped with an electrode (Sentix, WTW electronic). During the measurements, care was taken to immerse the electrode in the mixture fully, and distilled water was used to clean the electrode for each measurement.
The water holding capacity (WHC) of the batters was evaluated in triplicate following the modified method of Hughes et al. (1997), and calculated using the following Eq. (1):
Where T is water loss after heating and centrifugation and M indicates the total moisture content of the sample.
The emulsion stability of the batters was evaluated based on the method described by Jiménez-Colmenero et al. (2010), with slight modifications. The total expressible fluid (TEF) and expressible fat (EFAT) values were calculated using the following equations. The water released (WR) was calculated as the difference between TEF and EFAT.
The processing yield (PY) of the samples was determined as a percentage by comparing the weight difference between the initial stuffing weight (W1) and the post-cooking weight (W2).
Color parameters [CIE L*(brightness, darkness), CIE a* (redness, greenness), and CIE b* (yellowness, blueness)] in the final product were determined using a chroma meter (CR-400, Konica Minolta, Tokyo, Japan). Color measurement was performed from the cross-sectional surface of the samples in 4 replicates. In addition, the redness index (RI), chroma angle (C*), Hue angle (h*), and Euclidean distance (ΔE) were determined to compare standard (C) and reformulated samples (A) following the guidelines set by the American Meat Science Association (AMSA, 2012), using the equations provided below:
Rheological analyses
The viscoelastic rheological properties of the emulsion samples were measured using a hybrid rheometer (TA-DHR3, TA Instruments, New Castle, DE, USA) with a parallel plate (40 mm diameter) measurement unit. Samples cooled to room temperature were compressed between two plates, and the ambient temperature was maintained at 20°C±1°C during the rheological measurements. The gap between the plates was 0.9 mm. Oscillation tests were performed to determine the linear viscoelastic region where the storage and loss moduli remained constant by conducting stress sweep tests in the 0.1–1,000 Pa at a frequency of 1 Hz. Then, taking into account the frequency ranges investigated in the literature for the viscoelastic properties of meat and meat products, an oscillatory frequency sweep test was carried out in the range of 0.1–10 Hz at a constant stress value of 1 Pa (obtained from the stress sweep in the linear region). The deformation curves of the emulsion samples were obtained by comparing the increasing frequency values. The storage modulus (G′) and loss modulus (G″) values were obtained from the data collected.
After the cooking process, the emulsion samples were cooled to 25°C and cut into cylindrical shapes (20 mm diameter and 10 mm height). Texture profile analysis of the samples was carried out using a TA-XT plus C texture analyzer (Stable Micro Systems Ltd., Surrey, UK) with three replicates. An aluminum cylindrical probe (SMS P/36R, 36 mm radius) was used to compress the samples twice to 50% of their original height, repetitively. Force-time graphs obtained through the device’s software were used to calculate TPA values such as hardness (N), springiness, gumminess (N), cohesiveness, chewiness (N), and resilience (Yılmaz et al., 2012). The analysis conditions were as follows: load cell=50 kg, post-test speed=2 mm/s, pre-test speed=1 mm/s, and test speed=1 mm/s.
The concentration of thiobarbituric acid reactive substances (TBARS) was determined using an adapted version of the extraction method described by Witte et al. (1970). The absorbance of the thiobarbituric extracts was measured at 532 nm, and TBARS values were reported as milligrams of malonaldehyde per kilogram of meat (mg MA/kg meat).
The data from the study were analyzed through the SPSS software’s general linear model (GLM) process (version 22.0, IBM, Armonk, NY, USA). The experiment comprised four treatment groups (C, A1, A2, and A3) and various storage periods (0, 7, and 15 d), which were considered fixed effects across each replication. The study involved two independent production batches, with quality parameters analyzed in triplicate for each batch. A one-way analysis of variance (ANOVA) was conducted to assess the effect of beef reduction and/or substitution with amaranth gel on quality attributes. Furthermore, a two-way ANOVA was run to assess the impact of storage periods and treatments. Replications were regarded as random effects, while formulation groups and storage time (especially for oxidation analysis) were treated as fixed elements. Whenever a fixed factor demonstrated significance, Duncan’s Multiple Range Test was used to compare the means at a 95% confidence level.
Results and Discussion
The chemical composition and energy values of MEs are given in Table 2. The incorporation of amaranth gel has been demonstrated to significantly influence MEs’ chemical composition and energy value. The A3 had the highest moisture content (65.81%), while the C had the lowest moisture value (62.19%; p<0.05). The increase in moisture levels is attributed to the addition of amaranth gel and the inclusion of extra water in the formulation. Protein contents of MEs ranged between 19.76% (C) and 22.13% (A3). An increment in the ratio of amaranth gel in the formulation resulted in an observed increase in the protein content of the samples (p<0.05). Researchers demonstrated that amaranth flour contained 17.37% crude protein (Kierulf et al., 2020). Conversely, as the substitution rate of beef with amaranth gel increased, a decrease in fat content was observed (p<0.05). Replacing beef with amaranth gel at concentrations of 30% and 40% led to a reduction in fat content from 14.16% to 8.39% and 5.84%, respectively (p<0.05). This result was explained by the replacement of beef in the formulation with amaranth flour, which had a lower fat content (8.40%). Similarly, the fat content of goat meat nuggets has been reported to be 6.99% in samples containing amaranth flour (Verma et al., 2019). The ash contents of MEs ranged between 2.33% (C) and 3.76% (A3). Similarly to our results, it has been found that replacing beef with amaranth flour in samples resulted in an increase in ash values when amaranth was used at concentrations of 10% and 15% (Suychinov et al., 2023).
Regarding the energy values, the samples exhibited a range from 148.30 (A3) to 214.01 (C) kcal/g. A substantial reduction in energy content was evident as amaranth gel levels were diminished (Table 2). Notably, MEs containing 100% beef exhibited the highest energy value, while reformulated samples formulated in amaranth gel demonstrated lower values (p<0.05). The A2 and A3 groups achieved notable reductions of over 17.92% and 30.70% in energy value, respectively, when compared to the C.
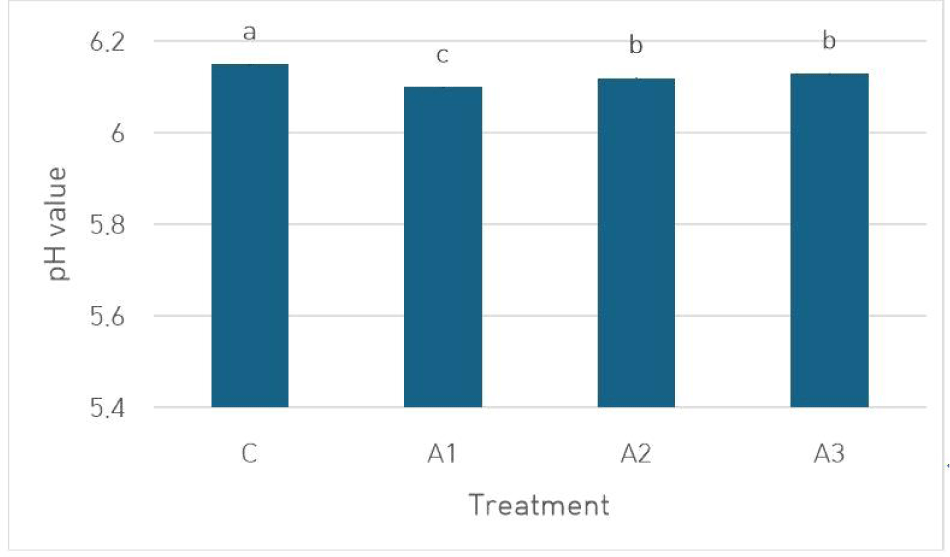
It is well known that the quality characteristics of meat products, such as hardness, color, WHC, and emulsion stability, are significantly influenced by pH levels (Young et al., 2004). The pH values of MEs are provided in Fig. 2. The pH values of MEs ranged between 6.10 (A1) and 6.15 (C). The utilization of amaranth gel on the pH values of samples was found to be significant (p<0.05). The pH values of the samples decreased regardless of the substitution rate when beef was replaced with amaranth gel (p<0.05). In line with our results, the meat patties without amaranth flour had a pH value of 6.14, while the lowest pH value of 6.0 was found in the sample with the highest concentration of amaranth flour (15%; Suychinov et al., 2023). This result indicated that adding amaranth flour to MEs could have caused a slight decrease in pH, likely due to the inherent acidity of amaranth flour (pH 5.59). This change in pH values among the groups was significant for the samples’ technological, and rheological properties.
WHC is a crucial quality parameter in the meat industry, impacting tenderness and juiciness, the key attributes determining consumer product acceptability. The WHC values of samples are given in Table 3. The WHC of meat emulsions ranged between 56.31 (C) and 91.10 (A3) and was significantly affected by adding AG (p<0.05). A linear increase in the WHC values of the MEs was observed with the increasing ratio of AG in the formulation (p<0.05). This result can be attributed to the functional properties of AG, studies have shown that amaranth protein has high water absorption capacity and emulsion (Twinomuhwezi et al., 2020; Zhang et al., 2023). The inclusion of non-meat proteins and hydrocolloids is believed to interact with meat proteins, thereby increasing the stability of the mixtures (Wu et al., 2023). Additionally, there was a strong correlation between protein content and WHC (Table 2), indicating that higher protein levels contribute to better water-holding capacity.
Emulsion stability is an indicator of the amount of fat and water retained in the matrix by meat proteins. TEF values decreased considerably with the addition of AG (p<0.05). A similar trend of decreasing TEF values in beef patties was observed with the increasing ratio of gel-form chia mucilage used in the formulation (Yüncü et al., 2022). On the other hand, there was no significant difference in the total expressible fat values between the A1 samples and the C group (p>0.05). Using more than 20% amaranth gel resulted in a decrease in EFAT values (p<0.05); however, there was no statistical difference observed among these groups (p>0.05). Amaranth protein has been found to have good oil absorption capacity (107.4% to 200.6%) and swelling power (13.3% to 45.9%; Nabubuya et al., 2022). These characteristics contribute to the functional properties of amaranth protein in food applications. In line with our study, replacing beef fat with a pea protein-agar agar gel at 70% and 100% levels resulted in a decreased amount of separated fat compared to the control (Öztürk-Kerimoğlu, 2021). The WR values of MEs are presented in Table 3. The highest WR values were observed in C and A2 (p<0.05). It was found that group C, which had the highest TEF and EFAT values, also had the highest WR value. Although the TEF value of the A2 group was lower compared to the other groups, it was thought that the WR value was high due to the low amount of fat separated from the emulsion structure, thus resulting in a higher rate of water loss from these samples.
In line with the WHC and emulsion stability, A3 treatments had the highest PY (84.05%) while C samples had the lowest (71.65%; p<0.05). Treatments formulated with higher concentrations of AG exhibited a significant increase in PY (p<0.05), demonstrating that AG effectively minimized fluid losses during the cooking process.
The incorporation of CM resulted in significant changes in the CIE L*, a*, and b* color parameters, as depicted in Table 4. CIE L*, a*, and b* values ranged between 47.38–60.98, 12.52–25.24, and 12.09–12.47, respectively. The use of amaranth gel and red beetroot powder in the formulation was found to have a significant effect on the CIE L* and a* values (p<0.05). The highest CIE L* value was observed in the C group, while a decrease in CIE L* values was detected in the reformulated samples (p<0.05). The decrease in the CIE L* value indicated that the sample had become darker in appearance due to the presence of amaranth. Similarly, the CIE L* value of nuggets decreased with the addition of 3% amaranth seed flour (Verma et al., 2019). The CIE a* values increased regardless of the usage rate of amaranth gel added to the formulation, with C showing the lowest CIE a* value (p<0.05). The inclusion of red beetroot powder in the amaranth gel’s preparation explained this circumstance. Red beetroots, rich in betalain pigments, including the red-violet betacyanins, have caused an increase in the CIE a* values of reformulated samples (Bahriye et al., 2023). Similar to our results, it has been reported that fermented dry sausage samples containing beetroot powder showed a decrease in CIE L* values and an increase in CIE a* values (Ozaki et al., 2021). No significant difference was noted in the CIE b* values of the MEs (p>0.05).
All color indexes were significantly affected by the replacing beef with amaranth gel. Due to higher CIE a* values, reformulated samples exhibited a higher RI, indicating more redness and less discoloration. While the highest RI was found in C, the highest value was found in A2 (p<0.05).
In the context of meat products, chroma value quantifies the intensity or saturation of color observed on the meat’s surface. While the lowest chroma value was found in C (16.32), the reformulated samples had higher values (p<0.05). Amaranth gel contains proteins that can act as effective emulsifying agents, which may enhance color intensity (Fidantsi and Doxastakis, 2001).
The hue angle (h°) indicates the shift in color from red to yellow, with larger angles suggesting a decreased presence of red in the product. The highest hue angle value was found in C (49.86), while a decrement was observed in the other groups regardless of the usage rate of the amaranth gel containing beetroot powder (p<0.05). This was consistent with the CIE a* values, as higher CIE a* values were observed in reformulated samples due to increased redness (Table 4). Similar to our result, researchers reported that adding red beetroot powder to pork sausages decreased the hue angle, suggesting a reddish color (Ha et al., 2015).
The total color difference (ΔE) was measured between the control and meat emulsions containing amaranth gel. The ΔE values of samples were determined as 23.46, 23.58, and 20.83 respectively. No statistically significant difference was found between A1 and A2 (p>0.05). Since all ΔE values of the samples are greater than 12, there is a substantial and noticeable color difference compared to the control group. This implies that panelists would easily perceive this distinction.
The textural properties of foods are quality parameters that are perceived through touch and chewing during consumption. They are also important in terms of their resistance to packaging, transportation, and storage conditions before consumption (Aydemir and Kurt, 2020). Particularly in emulsified meat products (such as sausages), the texture is an important quality parameter dependent on the batter’s structure, the amount of air within the batter, and the heat generated during the mixing (Girard et al., 1990). Table 5 shows the textural parameters of model meat emulsions. The utilization of amaranth gel containing beetroot powder was found to be a significant factor in all parameters (p<0.05).
The lowest hardness value was observed in the control group (27.56 N), while the reformulated samples had higher values especially, A2 showed the highest (45.65 N) hardness (p<0.05). The increase in hardness is likely due to the functional properties of amaranth flour, such as its water holding capacity and ability to form stable emulsions. It is believed that amaranth protein contributes to the formation of a firmer texture by interacting with meat protein (Tafadzwa et al., 2021). Similarly, several studies have found that increasing the level of amaranth flour in meat products like chicken nuggets and beef sausages leads to higher hardness values (Tafadzwa et al., 2021; Tamsen et al., 2018; Verma et al., 2019).
The springiness values decreased with the addition of amaranth gel to the formulation regardless of the utilization amount (p<0.05). The substitution of beef meat with a gel containing amaranth flour and beetroot powder reduced the elasticity values of the samples (p<0.05).
Cohesiveness is known as a measure of the difficulty in breaking down the internal structure of food. The highest cohesiveness value was determined in control (0.44), while the lowest (0.23) value was obtained in sample A2 (p<0.05). Similarly, goat nuggets containing amaranth flour exhibited the lowest cohesiveness values, while the control group had the highest (0.45; Verma et al., 2019).
Gumminess and chewiness are derived from textural parameters whose behavior is influenced by the primary parameters on which they depend. The highest gumminess value belonged to group A3 (17.58 N), while the lowest value was in group A2 (10.51 N; p<0.05). This result was due to the fact that A2 had also the lowest cohesiveness value. Chewiness, gumminess, and springiness were obtained by multiplying their respective measurements, and tenderness and toughness were defined as the energy required to chew solid foods (Szczesniak, 1963). The control group had the highest (6.40 N) chewiness, while the lowest value (3.04 N) was found in the A2 (p<0.05). Similarly, Yüncü et al. (2022) have reported that the chewiness of the beef patties decreased as the ratio of gel-like chia mucilage added to the samples increased.
The resilience values of the meat emulsions ranged from 0.07 (A2) to 0.15 (C) and showed a similar trend to the cohesiveness values and decreased with the addition of amaranth gel (p<0.05). Similarly, the resilience values of chicken meat emulsions decreased with the addition of different hydrocolloids (carrageenan, xanthan, potato starch) to the formulation (Polak et al., 2018).
A plate-plate measuring probe in a hybrid rheometer was utilized to evaluate the viscoelastic properties of meat products under different conditions. Prior research has concentrated on identifying the meat sample’s linear zone in dynamic oscillation tests (Cevik and Icier, 2020; Turgay-İzzetoğlu et al., 2022). Accordingly, stress-sweep tests were conducted over a range of 0.01–1,000 Pa at a fixed frequency of 1 Hz, which is commonly used for food materials (Sanchez et al., 2002). During these stress-sweep tests, changes in the storage modulus (G′) and loss modulus (G″) of the meat emulsions were monitored to identify the linear viscoelastic region. Following this, a frequency-sweep test was carried out at the determined constant stress value (1 Pa). The frequency range of 0.1–10 Hz was selected based on literature values for the viscoelastic properties of meat and meat products (Cevik and Icier, 2020). The G′ value, also known as the storage modulus, indicates the energy stored in the structure of the sample and subsequently released, in response to the applied stress. On the other hand, the G″ variable represents the viscous response of the analyzed sample and is the energy lost due to the applied stress, also referred to as the loss modulus (Gunasekaran and Ak, 2000).
The frequency-dependent variations of the elastic (G′) and viscous (G″) components of the emulsions are presented in Fig. 3. In the frequency sweep test, the storage modulus (G′) consistently exceeded the loss modulus (G″) across all Hz values, indicating a slight frequency dependency in all treatments. This characteristic viscoelastic behavior was the indicator for ‘weak gel’ properties, typical of a three- dimensional cross-linked gel network. The control group had the lowest G′ values across all frequencies (p<0.05). Similarly, in a study, samples without pea fiber and cassava starch had the lowest G′ values, while those containing cassava starch exhibited the highest elasticity, indicating a stabilized network structure (Correa et al., 2018). The frequency-dependent changes in G′ and G″ values indicated that the meat emulsions exhibited viscoelastic behavior, and the fact that G′>G″ throughout the frequency sweep for all treatments suggested that the elastic property dominated in the meat emulsions (Drake et al., 1999). Additionally, no crossover point between the elastic modulus and the viscous modulus was detected at any frequency value. On the other hand, substituting beef with amaranth gel not only increased the G′ values of the samples but also led to an increase in G″ values (p<0.05). This situation implied that amaranth gel contributed to the viscoelastic properties of meat emulsions, affecting not only their elasticity but also their viscous properties. A similar effect has been observed in meat emulsions where potato starch was used (Genccelep et al., 2015).
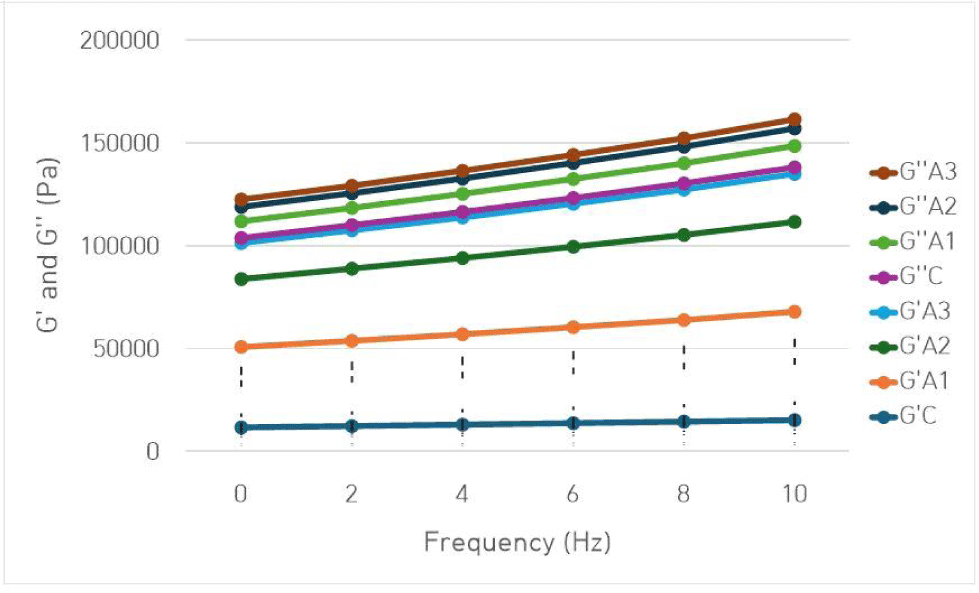
In correlation with the texture profile analysis, it was found that the A2 and A3 groups, which had the highest G′ values, also had the highest hardness values. Similarly, it was found that the A1 group, which had the highest G″ value, also had the lowest hardness value.
Lipid oxidation is a multifaceted process in meat products that results in the development of off-flavors, discoloration, nutritional degradation, and reduced shelf life. This reaction is influenced by the degree of unsaturated fatty acids present in the meat and is accelerated by oxidative stress (Shahidi, 2016). TBAR values of meat emulsions are presented in Fig. 4. The replacement of beef with amaranth gel in model meat emulsion was found to be effective on lipid oxidation (p<0.05). At the beginning of the storage, TBAR values ranged between 0.03 (A3) and 0.10 (C) mg MA/kg. The highest TBAR values were detected in the C group during the storage period (15 d; p<0.05). A considerable decrease in the TBAR values of the samples was observed with the increase in the amount of amaranth gel used in the formulation (p<0.05). This effect may be attributed to the antioxidative properties of the amaranth flour used in high amounts in the gel formulation (Antoniewska et al., 2018). Similarly, it has been observed that gelled emulsions formulated with amaranth flour had low TBAR values. This outcome has been attributed to the presence of protein and/or polysaccharide emulsifiers in pseudocereal flours, which can enhance the viscosity of the continuous phase, limit oxygen diffusion, and consequently inhibit lipid oxidation (Botella-Martínez et al., 2021). In similar studies, researchers have reported that pseudocereal flours such as amaranth prevent lipid oxidation due to their bioactive compounds, mainly phytosterols and tocotrienols (Antoniewska et al., 2018; Jiménez et al., 2020). Moreover, it is believed that the red beet powder included in the amaranth gel formulation may also exhibit antioxidative effects, which is why lower TBAR values were obtained in the reformulated samples. A study demonstrated the presence of bioactive compounds with relatively high antioxidant capacity, such as betalains and vitamin C, in red beetroot (Kongor et al., 2024).
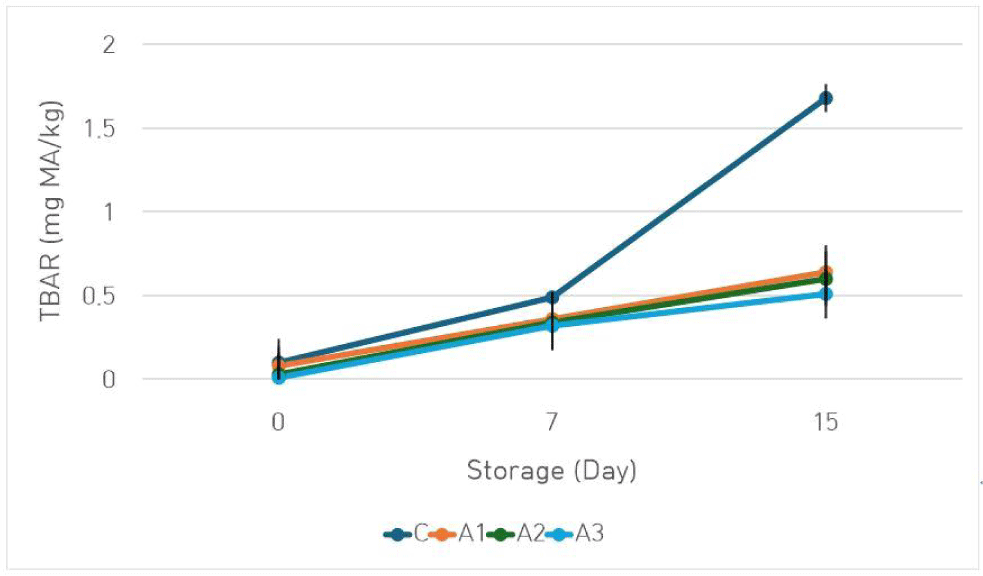
During storage, an increase in TBAR values was detected in all samples, ranging from 0.51 (A3) to 1.68 (C) at the end of the storage period. On the other hand, the TBAR values for all treatments did not exceed the limit value (<2 mg MA/kg; Witte et al., 1970) acceptable for meat products.
Conclusion
This study investigated the effects of amaranth gel in model meat emulsions on nutritional, technological, rheological, and oxidative qualities. The addition of amaranth gel significantly impacted the chemical composition, energy values, pH, WHC, emulsion stability, color parameters, texture profile analysis, rheological properties, and lipid oxidation of the emulsions. Specifically, increasing concentrations of amaranth gel in formulation led to an increase in protein content, a decrease in fat content, an enhancement in WHC, and an improvement in oxidative stability of model system meat emulsion. The higher hardness and elasticity values observed in samples containing amaranth gel suggest an enhancement in the structural integrity of the emulsions, and the fact that G′>G″ throughout the frequency sweep for all treatments indicates that the elastic property dominated, demonstrating that the meat emulsions exhibited viscoelastic behavior. These results highlight the potential of partially or fully replacing animal-based ingredients with plant-based alternatives formulated with amaranth gel in meat-based products, meeting consumer demand for healthier options while offering practical benefits in product formulation and quality enhancement.


